How attractive are countries tax systems for new investment? Ernst & Young LLP professionals look at how the U.S. compares to other countries in the Americas in its desirability as a location for new investment before the 2017 tax law, after the enactment of the 2017 tax law, and after tax rate increases that presumptive Democratic nominee Joe Biden has expressed interest in.
How a country taxes capital income can affect its attractiveness for investment. Economic research has suggested that capital taxation has a strong impact on economic growth, and that high tax rates on capital can significantly impede capital formation. Given close trading relations in the Americas, how do countries in the Americas currently rank in terms of their tax burdens on capital investment? If the U.S. were to raise corporate income taxes, which other Americas countries might find themselves more tax competitive by comparison?
Once the Covid-19 pandemic subsides, economic recovery will be a major priority for the Americas. One critical set of policies that will receive attention will be capital taxation. Countries’ high tax burdens that discourage investment will need to be addressed.
This report ranks countries in the Americas in terms of their tax attractiveness for mobile capital. It also looks at possible changes to the U.S. corporate income tax and examines how those changes, if enacted, could influence tax policy across the Americas. Key findings include:
- Of the 19 countries in the Americas analyzed: Argentina, Bolivia, Brazil, Canada, Chile, Columbia, Costa Rica, Dominican Republic, Ecuador, Guyana, Jamaica, Mexico, Panama, Paraguay, Peru, Trinidad and Tobago, Uruguay, Venezuela, and the U.S. (the “19 Americas Countries”), those with the highest tax burdens on investment in 2019 were: (1) Brazil (37.4%), (2) Argentina (35.5%), (3) Guyana (33.9%), (4) Venezuela (33.8%), and (5) Ecuador (29.9%).
- The most tax-attractive Americas countries for investment, ranked by their capital tax burden on investment in 2019, were: (1) Paraguay (6.7%), (2) Chile (9.5%), (3) Canada (16.3%), (4) Panama (18.4%), and (5) Mexico (19.3%).
- In 2017, prior to enactment of the Tax Cuts and Jobs Act (TCJA), the U.S. was the third least tax-competitive country of the 19 Americas Countries, after Argentina and Brazil. The U.S. had a capital tax burden on investment of 34.6% in 2017. With the enactment of the TCJA, this burden dropped to 22.7% in 2019, making the U.S. the ninth most tax competitive country in the Americas.
- Presumptive Democratic nominee Joe Biden has expressed interest in raising the federal corporate income tax rate. Moreover, additional tax revenues may be sought following the trillions of Covid-related federal relief. If the U.S. were to increase its federal corporate income tax rate to 35%, it’s rate prior to the TCJA, or, possibly, more modestly to 28%, the U.S. would again be one of the least tax-competitive countries in the Americas.
Introduction
Why does a country’s level of competitiveness for capital investment matter? Capital investment is critical to growing an economy, providing the tools for workers to develop new products and services for the global economy. New projects create employment for workers of all types and investment dollars are needed to create and adopt the latest technologies.
Capital investment generates long-term benefits. When a business chooses to make multimillion-dollar investments, it is expecting the investment to support operations for many years. Thus, when a country attracts more capital, it generates years of income for workers and suppliers, as well as revenues for governments.
Many factors affect the willingness of businesses to make long-term investments in a country, including the quality of its workforce, availability of natural resources, robust infrastructure, political stability and, of course, taxation. Even though taxation is only one of several policy tools governments use to attract capital, it can have a powerful influence on investment and, ultimately, on job creation.
More than just the corporate income tax rate must be considered in determining the tax burden on investments. The tax burden is affected by cost deductions for depreciation, inventory expenses, and interest payments. Tax burdens are also influenced by other taxes related to a company’s capital expenditures—most notably sales taxes on capital purchases, transfer taxes on property and financial transactions, and asset-based levies.
This report ranks countries in the Americas according to the annualized value of capital taxes paid as a share of a company’s profitability sufficient to attract investor savings for new investments. We refer to this measure as the effective tax rate on new investment.
Of the 19 Americas Countries, those with the highest capital tax burdens on investment in 2019 were:
1. Brazil (37.4%),
2. Argentina (35.5%),
3. Guyana (33.9%),
4. Venezuela (33.8%), and
5. Ecuador (29.9%).
The most tax-attractive countries for investment were:
1. Paraguay (6.7%),
2. Chile (9.5%),
3. Canada (16.3%),
4. Panama (18.4%), and
5. Mexico (19.3%).
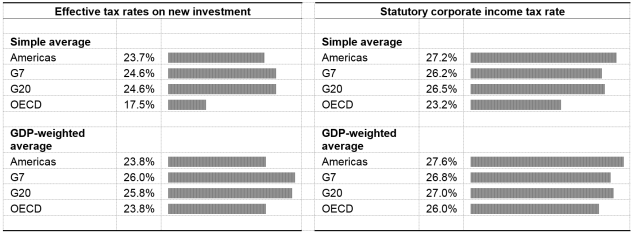
Overall, the 19 Americas Countries had an average tax burden of 23.7% (the GDP-weighted average is 23.8%). By comparison, the OECD countries had an average tax burden for 2019 of 17.5% (the GDP-weighted average is 23.8%).
In 2017, before the TCJA was enacted, the U.S. was the third least tax-competitive country out of the 19 Americas Countries, with an effective tax rate on new investment of 34.6%. As of 2019, the U.S. was the ninth most tax-competitive country in the Americas, with an effective tax rate on new investment of 22.7%.
Raising the U.S. federal corporate income tax rate to 28% or 35% would represent a significant increase in the U.S. corporate tax burden and revert the U.S. back to its position as one of the least tax-competitive countries.
How well do the Americas attract investment?
Private sector investment helps provide the tools needed for workers to produce goods and services in markets. Investment in plants, machinery, and structures enables businesses to adopt new technologies embedded in capital goods, which are critical to improving competitiveness in markets. Often, this investment comes from outside the recipient country by way of foreign direct investment (FDI).
Although numerous economic factors and policy considerations affect business investment decisions, including the quality of a country’s labor force, the quality of its infrastructure, and its political stability, economists generally agree that taxes also matter. The canonical view is that each 10% increase in the cost of capital (adjusted for taxes) lowers the capital stock by about 7% in the long-run. Studies focusing on FDI show an even bigger tax effect, with FDI flows growing as much as 2.5% for each one-percentage point reduction in the statutory corporate income tax rate.
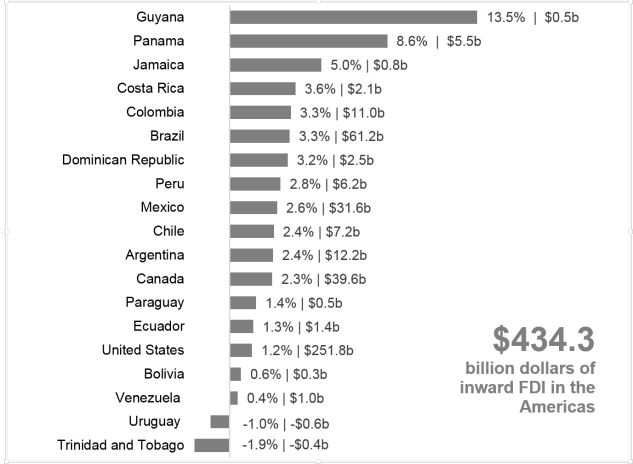
In absolute terms, the U.S., Brazil, Canada, Mexico, and Argentina were the largest recipients of FDI in the Americas in 2018. Of course, this reflects the large size of their economies. In contrast, as shown in Figure 1, inward FDI is more important to a number of the smaller economies in the Americas when considered in relation to each country’s respective GDP. For example, although Costa Rica and Jamaica had comparatively lower levels of FDI in 2018, FDI made up approximately 3% to 5% of their GDP.
Figure 1. FDI as share of GDP for 19 Americas Countries, 2018
Percent of GDP | Billions of U.S. dollars
Note: Most recent year available for complete data of countries analyzed is 2018.
Source: UNCTAD Stat Data Center, Foreign direct investment: Inward and outward flows of stock, annual, 1970-2018.
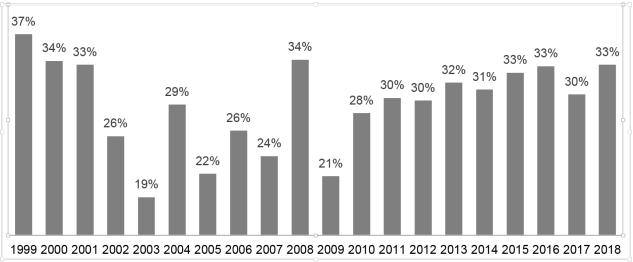
Americas’ share of world inward FDI fell during the 2008 financial crisis, but since then has been recovering (see Figure 2). In 2018, inward FDI for the Americas was driven primarily by the investment in the U.S. (58%); nearly 90% of the Americas’ FDI is in the U.S., Brazil, Canada, and Mexico.
Figure 2. Americas’ share of worldwide FDI, 1999-2018
Note: Most recent year available for complete data of countries analyzed is 2018.
Source: UNCTAD Stat Data Center, Foreign direct investment: Inward and outward flows of stock, annual, 1970-2018; EY analysis.
Taxes as an investment cost
In ranking a locale on its ability to attract investment, taxes as a cost of investing can figure prominently. In most of the Americas, capital investment can move freely between countries with open markets. As a result, where the non-tax investment conditions are similar, multinational companies decide whether to invest in a country by gauging the tax cost compared to that in other countries.
Most agree that companies, per-se, do not bear the taxes they pay. That is because companies are legal fictions and only people, in their roles as workers, investors or consumers, can bear the burden of a tax.
An important result from theoretical and empirical studies is that taxes imposed on business in an economy open to trade and to capital flows will be generally passed on to those factors that are least mobile. In general, workers are less mobile than is capital. Capital can relatively easily move from country to country in search of the highest after-tax return. In contrast, workers typically do not move from country to country seeking the highest after-tax wage.
As a result, workers can bear a significant share of the burden of taxes on businesses in the form of higher prices on consumer goods and/or lower real wages. Conversely, lower tax costs for companies work in the opposite direction and can benefit workers through higher real wages and lower prices for consumer goods. That is, reducing taxes on capital income can lead to increased capital inflows and domestic savings and with more capital available for each worker to work with labor productivity and wages rise.
Effective tax rate on new investment—how do countries in the Americas rank?
Tax systems across the Americas often change as a result of globalization, which continues to change the relative power of economic partners, and countries’ tendency to alter their tax systems in light of economic and budget changes.
Canada, for example, reduced its statutory corporate income tax rate from 43% in 2000 to 26.8% today to promote job creation. With additional policies that removed taxes on capital purchases and assets, Canada shifted from having the highest tax burden on new investment among OECD countries to being in the middle of the pack.
Similarly, changes in the U.S. enacted as part of the TCJA—principally, reducing the top statutory corporate income tax rate from 35% to 21%, temporarily reducing taxes on certain capital purchases, and increasing taxes on certain debt-financed investments—moved its system for taxing investment from being the third least attractive to the ninth most attractive in terms of investment.
The statutory corporate income tax rate is just one of the many components of the tax burden on investment. Investors can, and do, focus on both the corporate income tax rate and the other tax provisions that affect the tax burden on investment. For example, although Colombia has a relatively high statutory corporate income tax rate compared to other countries in the Americas, it has one of the lowest tax burdens on investments due to its tax code’s various deductions and tax credits that reduce tax costs. In contrast, Ecuador has a relatively low corporate income tax rate on reinvested earnings but a relatively high effective tax rate on new investment due to a tax on assets and a transfer tax.
Tax burdens vary across countries, depending on provisions for recovering capital costs (depreciation, financing, and inventory costs), as well as other taxes on capital that include asset-based taxes, sales taxes, and transfer levies.
MEASURING TAX COMPETITIVENESS
Public policy analysis commonly uses the effective tax rate on new investment—also called the marginal effective tax rate on new investment—to understand how the tax structure affects capital investment, and thus to evaluate tax competitiveness.
A business invests in capital until the return on capital, net of taxes and risk costs, is equal to the cost of holding capital. At the margin, the investment decision will be affected by taxes paid on capital investments. If taxes increase, the business will earn after-tax returns that are lower than financing costs. The business will then cut back investment and only accept projects with a sufficiently high rate of return to cover both financing costs and taxes. Thus, the effective tax rate on new investment, or tax wedge, is a good indicator of how investment is affected by taxation—the higher the tax wedge, the lower investment will be, and vice versa.
For example, suppose companies must pay out in after-tax profits a return (net of risk and taxes) equal to 5% to attract financing from equity and bondholders for a new investment project. If the tax wedge is 50%, the company must earn a 10% net-of-risk rate of return to cover taxes and cost of financing. If the project earns less than 10% as a pre-tax rate of return, the project will not move forward. Of course, some projects might earn more than a 10% rate of return on capital, but as long as the minimal rate of return is earned, a project will be profitable to undertake. Therefore, if the tax wedge decreases, more investment projects become profitable because a lower rate of return is acceptable to cover both tax and financing costs.
In short, the effective tax rate, or tax wedge, is the portion of capital-related taxes paid as a share of the pre-tax rate of return on capital for marginal investments (on the assumption that businesses invest in capital until the after-tax return on capital is equal to the cost of financing capital). Included are corporate income taxes, sales taxes on capital purchases and other capital-related taxes, such as financial transaction taxes and asset-based taxes.
To compare the tax systems of countries in the Americas, this analysis includes manufacturing and service industries (services include construction, utilities, transportation, communications, trade, and other business and household services). Companies invest in structures, machinery, inventory, and land to develop their various projects. They use retained earnings, new share issues, and debt to fund their projects. Capital structures and financial ratios are equalized across countries to isolate tax effects. Inflation rates vary across countries to take into account their interaction with tax systems, with some such as Chile indexing taxable profits for inflation.
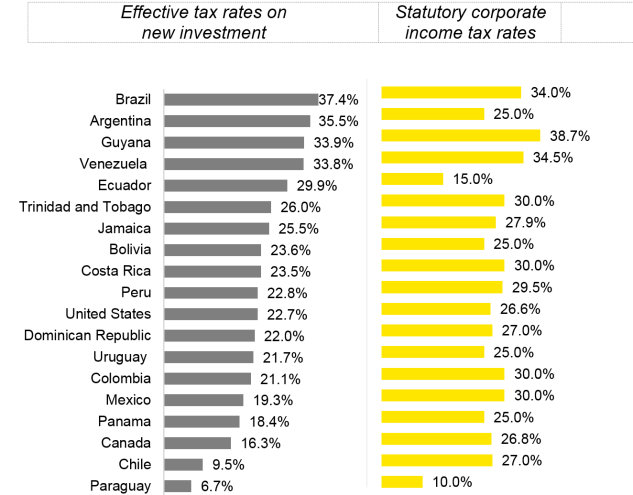
Figure 3 provides the estimated 2019 effective tax rates on new investment for the 19 Americas Countries, as well as the top combined central-subnational statutory corporate income tax rates for comparison purposes. Countries are ranked in Figure 3 according to their tax burden on new investment as reflected by their effective tax rates—with the highest burdens in Brazil, Argentina, Guyana, Venezuela, and Ecuador.
Figure 3. 2019 Effective tax rates on new investment and top statutory corporate income tax rates for 19 Americas Countries
Note: Effective tax rates for individual countries are weighted by the manufacturing and service industry components of GDP. The top statutory corporate income tax rates reflect effective income tax rates that integrate both national and subnational rates, as well as surtaxes and other measures that effectively modify the statutory rate.
Source: 2019 calculations by Philip Bazel and Jack Mintz, School of Public Policy, University of Calgary.
Table 1. 2019 Average of effective tax rates on new investment and top statutory corporate income tax rates for select country groupings in the Americas
Note: Effective tax rates for individual countries are weighted by the manufacturing and service industry components of GDP. The top statutory corporate income tax rates reflect effective income tax rates that integrate both national and sub-national rates, as well as surtaxes and other measures that effectively modify the statutory rate. These rates are then averaged for countries within the selected country groupings listed above.
Source: 2019 calculations by Philip Bazel and Jack Mintz, School of Public Policy, University of Calgary.
Of the 19 Americas Countries, only three impose a lower effective tax rate on new investment than the OECD simple average of 17.5%.
Brazil, with an effective tax rate on new investment of 37.4%, has the least-competitive tax system of the 19 Americas Countries for attracting investment. Brazil has a relatively high corporate income tax rate at 34.0%, which is third highest among the 19 Americas Countries. Indirect taxes imposed also contribute to Brazil’s high effective tax rate. It has four value-added taxes at the federal and state levels and these taxes apply to purchases of capital assets, especially for the services sector under the federal Tax on Industrialized Products (IPI), the Social Integration Program (PIS), and the Social Security Financing Contribution levies. Brazil also assesses a financial transaction tax and a municipal tax on gross receipts, both of which add to the effective tax burden. While Brazil offers several tax incentives, including an allowance for corporate equity financing (limited to 50% of profits), these are insufficient to fully counteract the high statutory rate, the indirect taxes on purchases of capital assets, and the transaction taxes.
Argentina has the next highest tax burden on investment at 35.5%, followed by Guyana at 33.9%. Although Argentina’s top statutory corporate income tax rate fell from 35% in 2017 to 25% in 2019, indirect and transfer taxes on real estate and financial transactions cause its high tax burden on investment to persist. Guyana’s high tax burden on investment is largely the result of its high statutory corporate income tax rate.
The U.S. is the largest economy in the Americas and has the ninth lowest tax burden on capital (22.7%). Its average combined federal-state statutory corporate income tax rate is 26.6% (the federal rate is 21% and, for businesses, state taxes are partially deductible from federal income). Although various tax incentives, such as bonus depreciation, reduce the tax component of business costs, state retail sales taxes on capital purchases and state and local asset-based taxes increase the tax burden on capital by almost six percentage points.
Latin American countries at one time faced very high inflation, leading many governments to adjust profits to remove the impact of inflation. Some countries, including Chile, continue to reduce the tax burden on corporate profits by adjusting for inflation. Chile, with an effective tax rate of 9.5% is the second most tax-competitive regime in the Americas, largely due to accelerated depreciation for machinery investments. It has a few relatively minor indirect or transfer taxes on capital. Nonetheless, Chile has been increasing its tax rate on businesses in the past several years. The statutory corporate income tax rate increased from 24% in 2016 to 25% or 25.5% in 2017, and is 25% or 27% as of 2019, depending on the tax regime elected by the company.
Mexico has a top statutory corporate income tax rate a little higher than the 26% OECD GDP-weighted average and levies a transfer tax on real estate ranging from 2% to 4.5%, but otherwise relies on few non-income-based taxes on capital investments. Mexico’s 2020 tax reform implements some significant provisions that may affect foreign companies operating in the country. Criteria for multinationals to receive preferred tax regimes have been tightened. However, the shelter maquiladora program, which allows foreign companies new to Mexico to pay no income tax for four years by partnering with a local contractor will continue to be offered in coming years.
Canada has reformed its corporate tax system more frequently and more significantly than any other country in the Americas by implementing three complementary policy initiatives over the span of 15 years. First, the federal-provincial corporate income tax rate fell by graduated steps from 43% in 2000 to 26.8% in 2019. Second, the federal government and most provinces eliminated a tax on assets of non-financial corporations (financial companies still bear some asset taxes). Third, provincial retail sales taxes have been harmonized with the federal value-added tax in a number of provinces, which eliminated sales taxes on capital purchases. As a result, Canada managed to reduce its effective tax rate on new investments by nearly one-half in 2017 (effective tax rate of 20.9%), and the rate fell further in 2019 to 16.3%. However, Canada’s tax burden on capital has increased since 2012, due to some federal and provincial tax increases.
Looking ahead—outlook on U.S. future competitiveness
An increase in the U.S. corporate income tax rate could introduce complex changes that would significantly impact the rankings presented here.
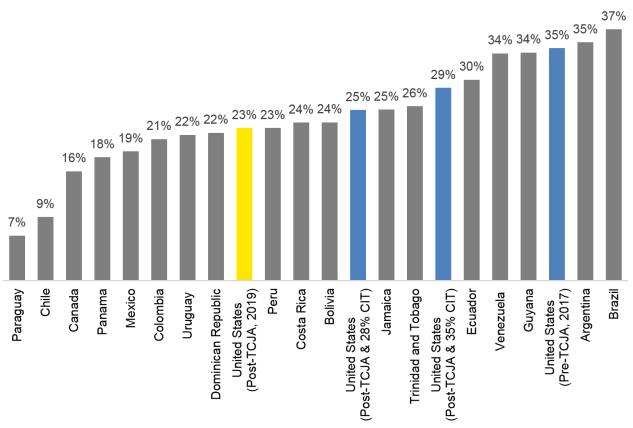
Before the TCJA was enacted in December 2017, the top U.S. statutory corporate income tax rate had remained essentially unchanged for several years at approximately 39% (including both the federal rate and a weighted average state corporate income tax rate). This was the highest rate amongst all of the 19 Americas Countries. The TCJA lowered the federal statutory corporate income tax rate to 21%, which resulted in a dramatic shift in U.S. tax competitiveness. At the 39% combined federal-state corporate income tax rate, the U.S. was the third least tax-competitive country out of the 19 Americas Countries, after Argentina and Brazil, with a capital tax burden on investment of 34.6% in 2017. After the TCJA, which cut the corporate tax rate to 21%, in addition to making other changes, the U.S. capital tax burden on investment dropped to 22.7% in 2019, making the U.S. the ninth most tax-competitive country in the Americas today.
Presumptive Democratic nominee Joe Biden has proposed raising the federal corporate income tax rate to 28%, the same rate the Obama administration proposed to replace the 35% corporate tax rate. Moreover, additional tax revenues may be sought following the trillions of Covid-related federal relief. If the U.S. were to increase its federal corporate income tax rate to 35%, where it was prior to the TCJA, or, possibly, to 28%, the U.S. would return to its position as one of the least tax-competitive countries in the Americas.
An increase in the U.S. federal corporate income tax rate would raise the tax burden on new investment and weaken the U.S.’ overall competitive position within the Americas, as well as globally. Figure 4, below, presents estimated effective tax rates under various potential corporate income tax rate increases, as well as current effective tax rates on new investments across countries in the Americas for comparison. These estimates indicate that an increase in the corporate income tax rate would not cause the U.S. to have the highest tax burden in the Americas. Nonetheless such an increase would significantly raise the tax cost of investment in the U.S., making the U.S. a much less attractive investment location.
Figure 4. U.S. effective tax rates under various corporate rate reductions, and select countries in the Americas
Source: 2019 calculations by Philip Bazel and Jack Mintz, School of Public Policy, University of Calgary.
Conclusion
A country’s tax policies are just one factor companies consider when determining where to invest capital. Nonetheless, as globalization continues to shape and reshape where and how companies do business, policymakers will likely focus on ways to make their countries more attractive for investment. For countries in the Americas, any significant increase in the U.S. statutory corporate income tax rate would push the U.S. lower in the Americas ranking of capital tax burdens on investment. This would allow other countries, including those countries that currently have a higher tax burden than the U.S., to become more tax competitive compared to the U.S.
This column does not necessarily reflect the opinion of The Bureau of National Affairs, Inc. or its owners.
Author Information
This report is the second installment of the EY Investing in the Americas report following, “Investing in the Americas—2017 Tax Competitiveness,” Bloomberg BNA, Daily Tax Report, November 1, 2019. The views expressed are those of the authors and do not necessarily reflect the views of Ernst & Young LLP or other members of the global EY organization.
Jack Mintz is National Policy Advisor at Ernst & Young LLP.
Bob Carroll is a principal, James Mackie is an executive director, Brandon Pizzola is a senior manager, and Aaroshi Sahgal is a staff analyst in EY’s Quantitative Economics and Statistics group.
Learn more about Bloomberg Tax or Log In to keep reading:
See Breaking News in Context
From research to software to news, find what you need to stay ahead.
Already a subscriber?
Log in to keep reading or access research tools and resources.


